Mizzou works diligently to accurately track its greenhouse gas emissions. MU breaks down its emissions into three categories. These tiers measure emissions from different sources through increasing levels of complexity. Tier one emissions are relatively easy to calculate, but on the other hand tier three emissions can be quite tricky to calculate. For more information on how greenhouse gasses are inventoried, check out this link to the refined 2019 IPCC guidelines for greenhouse gas inventories.
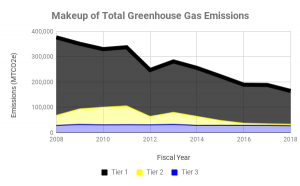
| Tier1 MTCO2e | Tier2 MTCO2e | Tier3 MTCO2e | Total MTCO2e | |
| FY08 | 308,922 | 39,563 | 27,606 | 376,091 |
| FY09 | 257,737 | 61,086 | 31,730 | 350,554 |
| FY10 | 230,116 | 69,466 | 29,988 | 329,570 |
| FY11 | 232,422 | 73,967 | 30,594 | 336,983 |
| FY12 | 183,929 | 32,931 | 30,031 | 246,890 |
| FY13 | 201,630 | 47,298 | 31,879 | 280,807 |
| FY14 | 192,160 | 35,254 | 27,873 | 255,287 |
| FY15 | 175,484 | 18,767 | 28,213 | 222,464 |
| FY16 | 152,800 | 8,026 | 27,955 | 188,782 |
| FY17 | 154,015 | 5,893 | 27,871 | 187,779 |
| FY18 | 131,901 | 5,411 | 26,730 | 164,042 |
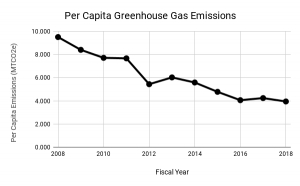
Emissions and Mizzou students, faculty and staff
One great way for Mizzou students, faculty and staff to visualize how greenhouse gas emissions fluctuate with the student, faculty and staff population on campus. Certain aspects of calculating emissions for off-campus residents such as those from commuting can be incredibly hard to track down, and are largely missed by these calculations.
|
Per Student Capita MTCO2e output
|
|
| FY08 | 0.105 |
| FY09 | 0.119 |
| FY10 | 0.130 |
| FY11 | 0.130 |
| FY12 | 0.184 |
| FY13 | 0.166 |
| FY14 | 0.179 |
| FY15 | 0.209 |
| FY16 | 0.247 |
| FY17 | 0.236 |
| FY18 | 0.254 |
Emissions and Mizzou buildings
Like comparing emissions data to campus users, comparing emissions data to the overall amount of building space on campus can also help to identify trends in how efficiently MU’s buildings are operating. The below comparison is made by dividing the total scope 1 and 2 emissions calculated by the total gross square foot of building measured on campus. Although not all emissions recorded are directly the result of buildings, this measure can help to provide a rough estimate as to the efficiency of our buildings at Mizzou.
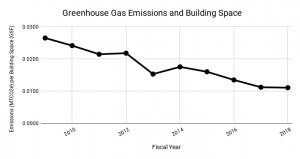
| MTCO2e/sqft | |
| FY08 | 0.0265 |
| FY09 | 0.0242 |
| FY10 | 0.0215 |
| FY11 | 0.0218 |
| FY12 | 0.0153 |
| FY13 | 0.0176 |
| FY14 | 0.0160 |
| FY15 | 0.0135 |
| FY16 | 0.0112 |
| FY17 | 0.0111 |
| FY18 | 0.0094 |