As a whole, the University of Missouri uses a considerable amount of energy! Think of all the day to day operations that get undertaken here on the Mizzou campus: all the extensive research equipment, all the lighting and heat necessary to make comfortable learning happen and all the computing power necessary just to keep things afloat! With all these drains on power, it is no wonder that Mizzou’s energy consumption consistently tops one-hundred and fifty million kilowatt hours per year.
LEED on Campus
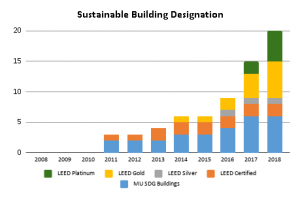
Mizzou has worked hard to cut their electricity consumption over the past ten years. Accomplishing this has, in part, been done by increasing the energy efficiency of buildings on the Mizzou campus. The trend in increasing energy efficiency is also impacted by the construction of new energy efficient LEED buildings on campus. Below is a graph illustrating the growth of LEED buildings across the MU campus. Among other benefits, LEED buildings are more energy efficient and contribute much less to both electricity consumption and greenhouse gas emissions.

Per-Capita Electricity Consumption
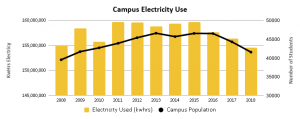
Comparing electricity use against campus population can give Mizzou students, faculty and staff a much more personalized look into how the Mizzou community as a whole consume energy on campus. A careful examination of the data presented below shows a fairly clear trend of energy consumption rising and falling with rises and falls in campus population.

| Electric Use (kwhrs) |
Campus Population
|
|
| FY08 | 155,038,037 | 39,570 |
| FY09 | 158,447,075 | 41,728 |
| FY10 | 155,767,034 | 42,747 |
| FY11 | 159,712,779 | 43,953 |
| FY12 | 159,641,886 | 45,437 |
| FY13 | 158,835,949 | 46,638 |
| FY14 | 159,357,677 | 45,731 |
| FY15 | 159,725,448 | 46,584 |
| FY16 | 157,626,248 | 46,557 |
| FY17 | 156,377,124 | 44,333 |
| FY18 | 154,578,813 | 41,593 |
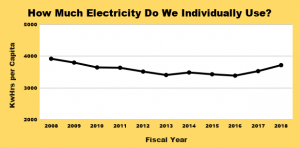
This final graph for per capita electricity consumption shows how throughout the years the MU campus population has overall decreased their individual electricity consumption until 2017 where the trend reverses. This means that since 2017, more electricity has been used per person on campus.

| Electric Use (kwhrs) | Campus Population |
Kwhrs per capita
|
|
| FY08 | 155,038,037 | 39,570 | 3918.070179 |
| FY09 | 158,447,075 | 41,728 | 3797.140409 |
| FY10 | 155,767,034 | 42,747 | 3643.929017 |
| FY11 | 159,712,779 | 43,953 | 3633.717357 |
| FY12 | 159,641,886 | 45,437 | 3513.477694 |
| FY13 | 158,835,949 | 46,638 | 3405.719563 |
| FY14 | 159,357,677 | 45,731 | 3484.6751 |
| FY15 | 159,725,448 | 46,584 | 3428.761978 |
| FY16 | 157,626,248 | 46,557 | 3385.661619 |
| FY17 | 156,377,124 | 44,333 | 3527.330075 |
| FY18 | 154,578,813 | 41,593 | 3716.462217 |
Electricity Consumption Based on Building Space
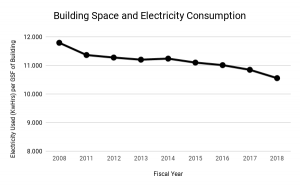
Another way to look more deeply into electricity consumption is to compare it against the gross square feet of building space on campus. The vast majority of electricity used on the MU campus is consumed within the confines of a building, so it makes sense that the more building space means more electricity consumption. Comparing electricity consumption to building space can also inform about the overall energy efficiency of buildings on campus.

| Fiscal Year | Annual Kilowatt Hours per Gross Square Foot of Building Space |
| FY08 | 11.793 |
| FY09 | 12.002 |
| FY10 | 11.166 |
| FY11 | 11.365 |
| FY12 | 11.276 |
| FY13 | 11.202 |
| FY14 | 11.239 |
| FY15 | 11.100 |
| FY16 | 11.011 |
| FY17 | 10.848 |
| FY18 | 10.556 |