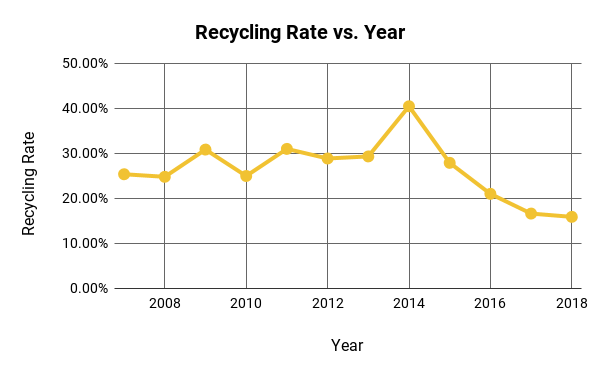
When most people think about sustainability, recycling is often one of the first things that come to mind. Recycling at Mizzou has taken many shapes and forms throughout the years. The clearest way to think about it is in terms of the percent of waste diverted per year. Below is a graph representing this data.

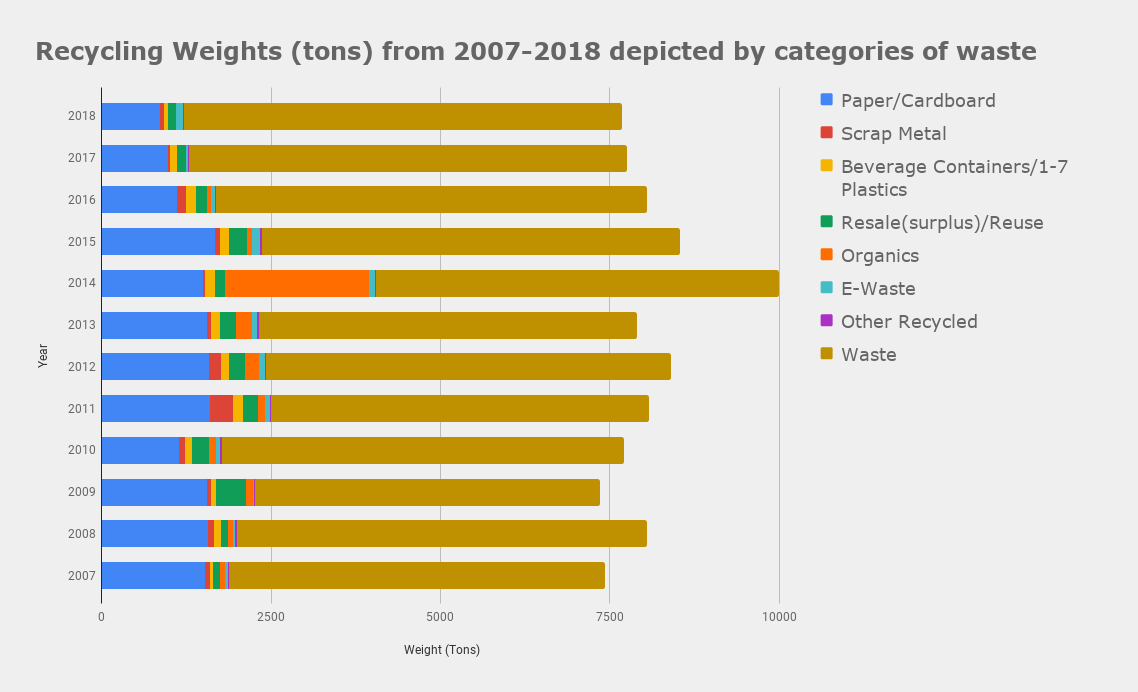
Interestingly, recycling on campus has not been a clear path; rather there have been many explored recycling options throughout the years. Below is a chart showing the composition and amount of waste Mizzou has produced through the years. It is important to note in this graph that there are factors that greatly affect the recorded amount of waste/recycled materials. Policies throughout the years change and in other instances data is lost or unrecorded.

| Category | 2007 | 2008 | 2009 | 2010 | 2011 | 2012 | 2013 | 2014 | 2015 | 2016 | 2017 | 2018 |
| Paper/Cardboard | 1518.7 | 1565.61 | 1553.51 | 1138.43 | 1606.1 | 1578.8 | 1551.44 | 1489.07 | 1678.61 | 1111.37 | 985.57 | 855.46 |
| Scrap Metal | 83.88 | 90.67 | 66.25 | 95.68 | 338.97 | 176.77 | 69.03 | 31.61 | 64.17 | 132.24 | 27.56 | 67.37 |
| Beverage Containers/1-7 Plastics | 47.21 | 107.19 | 65.73 | 101.72 | 134.68 | 124.75 | 122.38 | 147 | 131.12 | 149.42 | 102.92 | 52.16 |
| Resale(surplus)/Reuse | 92.9 | 94.81 | 439.04 | 245.1 | 222.4 | 228.12 | 240.85 | 156.73 | 267.99 | 155.33 | 122.43 | 120.25 |
| Organics | 76.65 | 83.5 | 105.5 | 105.5 | 105.5 | 207.5 | 235.03 | 2113.5 | 80.9 | 60.68 | 0 | 0 |
| E-Waste | 42.07 | 27.1 | 24.67 | 66.2 | 73.68 | 94.32 | 78.78 | 97.71 | 116.7 | 67.08 | 39.17 | 112.12 |
| Other Recycled | 25.59 | 26.93 | 15.08 | 18.98 | 23.73 | 13.44 | 18 | 14.62 | 22.57 | 15.72 | 13.08 | 14.67 |
| Waste | 5544.6 | 6046.19 | 5082.22 | 5930.87 | 5569.97 | 5970.06 | 5580.62 | 5950.14 | 6173.98 | 6354.29 | 6461.7 | 6456.29 |
| Total (Tons) | 7431.6 | 8042 | 7352 | 7702.48 | 8075.03 | 8393.76 | 7896.13 | 10000.38 | 8536.04 | 8046.13 | 7752.43 | 7678.32 |
Per Capita Waste
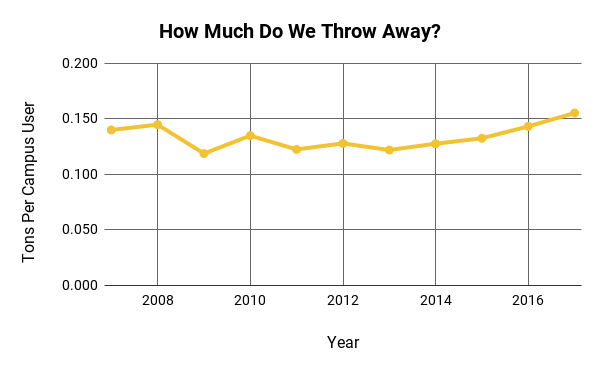
On a campus of Mizzou’s size, it can be easy to get mixed in with the crowd. What is important to remember; however, is that we are all individuals with individual choices to make. Recycling, although exceptionally important, all boils down to a personal choice each and every one of us have to make for ourselves. A brief glance at the graph below shows that the overall trend in waste generated per campus user per year has steadily increased since 2013. Indeed it would be fair to say some activities on campus generate much more waste than the average campus user, this measurement is still a good rough indication of individual waste production on campus. It takes commitment from each and every one of us to begin to reduce this trend!
Paper Recycling
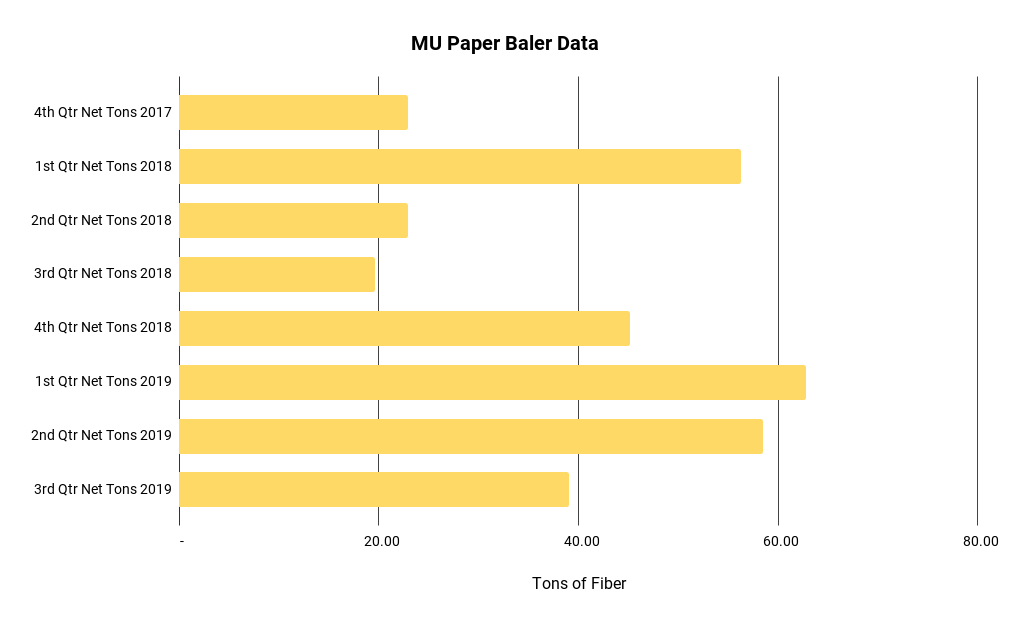
Were you aware that Mizzou has its own paper baler on campus? Mizzou’s Campus Facility staff collect paper (and to an extent cardboard) from recycling locations on campus and recycles it in-house. The revenue from this recycling effort goes towards funding the program.

It is not surprising that there are large dips in the tons of fiber recycled during the third quarter, as this represents July, August and September; times when activity on campus is low. Since the baler’s establishment, output growth in all quarters have been observed. This is extremely encouraging for the long-term sustainability of the baler program! Given the overall volatility of recycling on the Mizzou campus, the paper baler is a step in the right direction.
